TSNE
#include <Skigen/Manifold>
template <typename Scalar = double>
class Skigen::TSNE(n_components=2, perplexity=30, learning_rate=200, n_iter=1000, random_state=std::nullopt)
t-Distributed Stochastic Neighbor Embedding (t-SNE).
Nonlinear dimensionality reduction that embeds high-dimensional data in a low-dimensional space by modelling pairwise similarities as joint probabilities with Gaussian kernels in the input space and a Student-t kernel in the embedding space.
Mirrors sklearn.manifold.TSNE.
Parameters:
-
n_components : int, default=2 Dimension of the embedded space (default
2). -
perplexity : Scalar, default=30 Related to the number of nearest neighbors (default
30.0). -
learning_rate : Scalar, default=200 Gradient descent step size (default
200.0). -
n_iter : int, default=1000 Maximum number of iterations (default
1000). -
random_state : std::optional< uint64_t >, default=std::nullopt Optional RNG seed for reproducibility.
Attributes:
-
embedding : MatrixType Embedding vectors of shape (n_samples, n_components).
-
kl_divergence : Scalar Final KL divergence between P and Q.
Methods
SKIGEN_PARAMS()
Fit the t-SNE model: compute an embedding of X.
Parameters:
- X Input data of shape (n_samples, n_features).
Returns:
- result
Reference to the fitted transformer (
*this).
transform(X)
Return the stored embedding (same as fit result).
Because t-SNE has no parametric mapping, transform simply returns the embedding computed during fit. X is expected to be the same data that was used for fitting.
Parameters:
- X : MatrixType Data matrix (must match the training data shape).
Returns:
- result : MatrixType The embedding of shape (n_samples, n_components).
Example
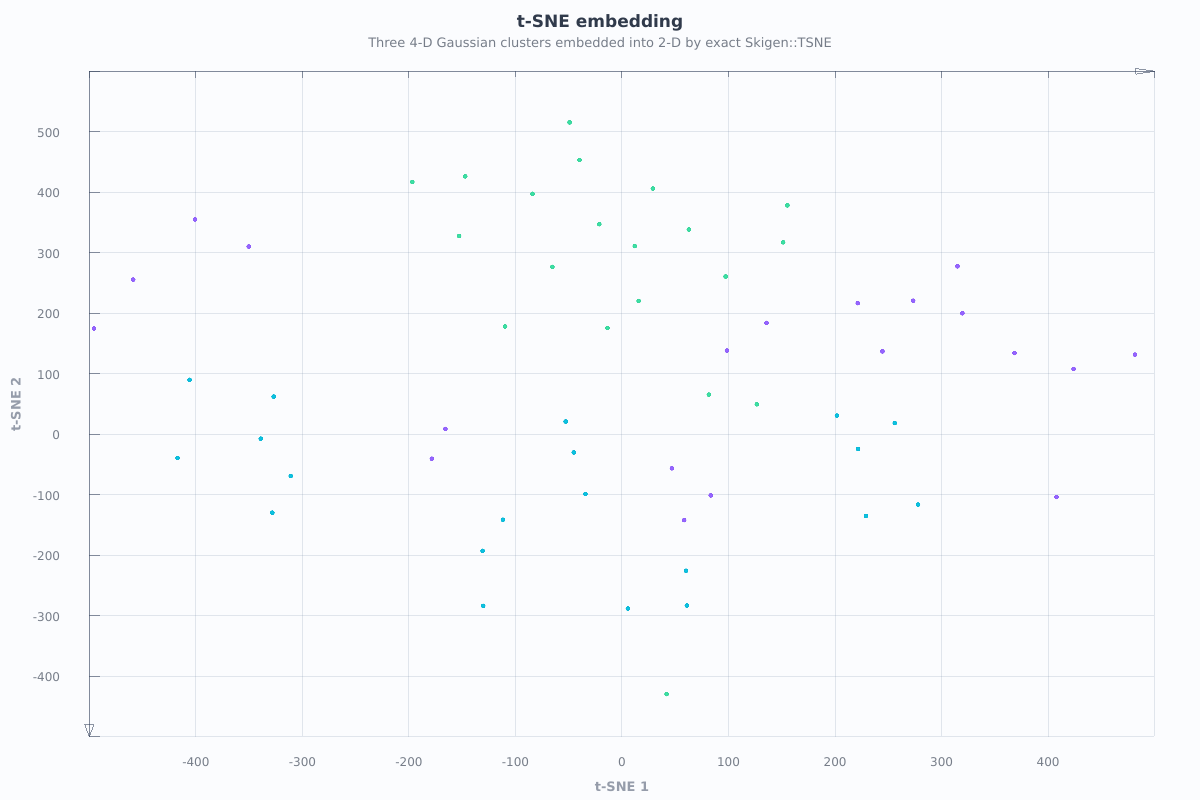
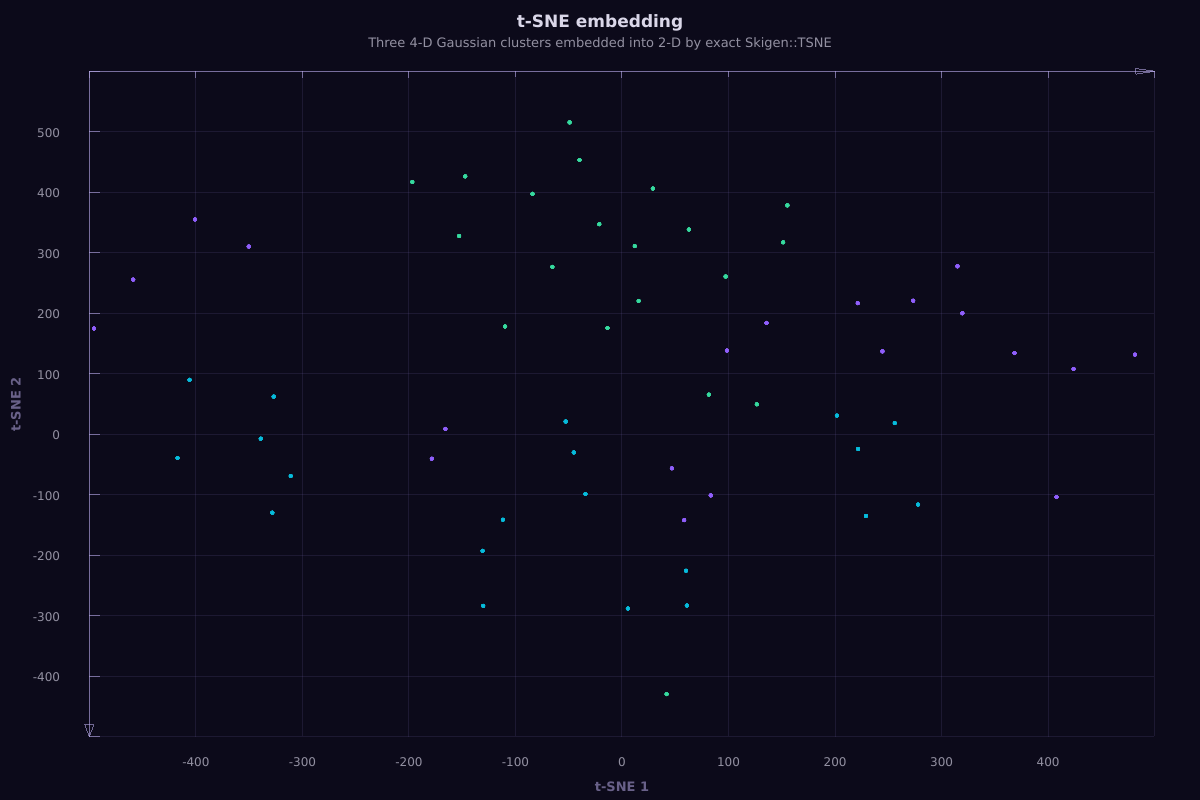
Plotting
The figure below is rendered from a registered SkigenPlot-enabled example during the documentation build.
Source example: examples/manifold/tsne.cpp
Eigen::VectorXi labels(n);
for (int c = 0; c < 3; ++c)
    for (int i = 0; i < n_per; ++i) labels(c * n_per + i) = c;

Skigen::Plot::Figure fig;
fig.title("t-SNE embedding")
   .caption("Three 4-D Gaussian clusters embedded into 2-D by exact Skigen::TSNE")
   .xlabel("t-SNE 1")
   .ylabel("t-SNE 2")
   .scatter(Y, labels);
return argc > 1 ? (fig.saveThemed(argv[1]) ? 0 : 1) : fig.show();