SVC
#include <Skigen/SVM>
template <typename Scalar = double>
class Skigen::SVC(C=1.0, kernel=Kernel::RBF, degree=3, gamma=0, coef0=0, probability=false, tol=1e-3, max_passes=50, random_state=std::nullopt)
C-Support Vector Classification with kernels.
Mirrors sklearn.svm.SVC for the binary case (multiclass via one-vs-one as in libsvm).
When probability=true, Platt scaling is fitted via internal 5-fold cross-validation on the decision function scores, providing calibrated posterior probabilities through predict_proba().
Attributes:
-
C : Scalar
-
kernel : Kernel
-
gamma : Scalar
-
classes : const Eigen::VectorXi
-
n_classes : int
-
support : const std::vector< Eigen::Index > &
-
n_support : int
Methods
SKIGEN_PARAMS()
fit(X, y)
Fit from a sparse design matrix (densifies internally).
predict(X)
predict(X)
Predict from a sparse design matrix (densifies internally).
decision_function(X)
Raw decision function — sum_s alpha_s y_s K(x, sv_s) + b.
predict_proba(X)
Calibrated posterior probabilities via Platt scaling.
Requires probability=true at construction time. Returns a (n_samples, 2) matrix with columns [P(y=class_0), P(y=class_1)].
fit(X, y)
predict(X)
Example
Plotting
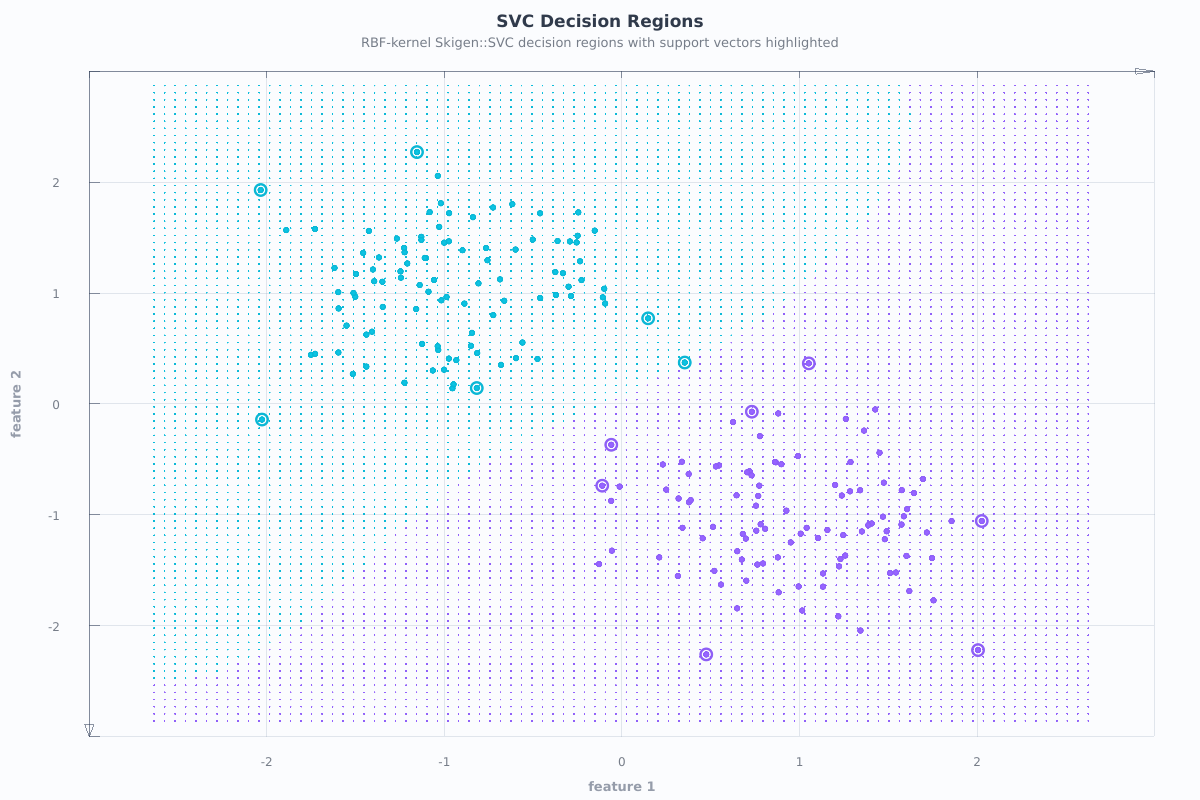
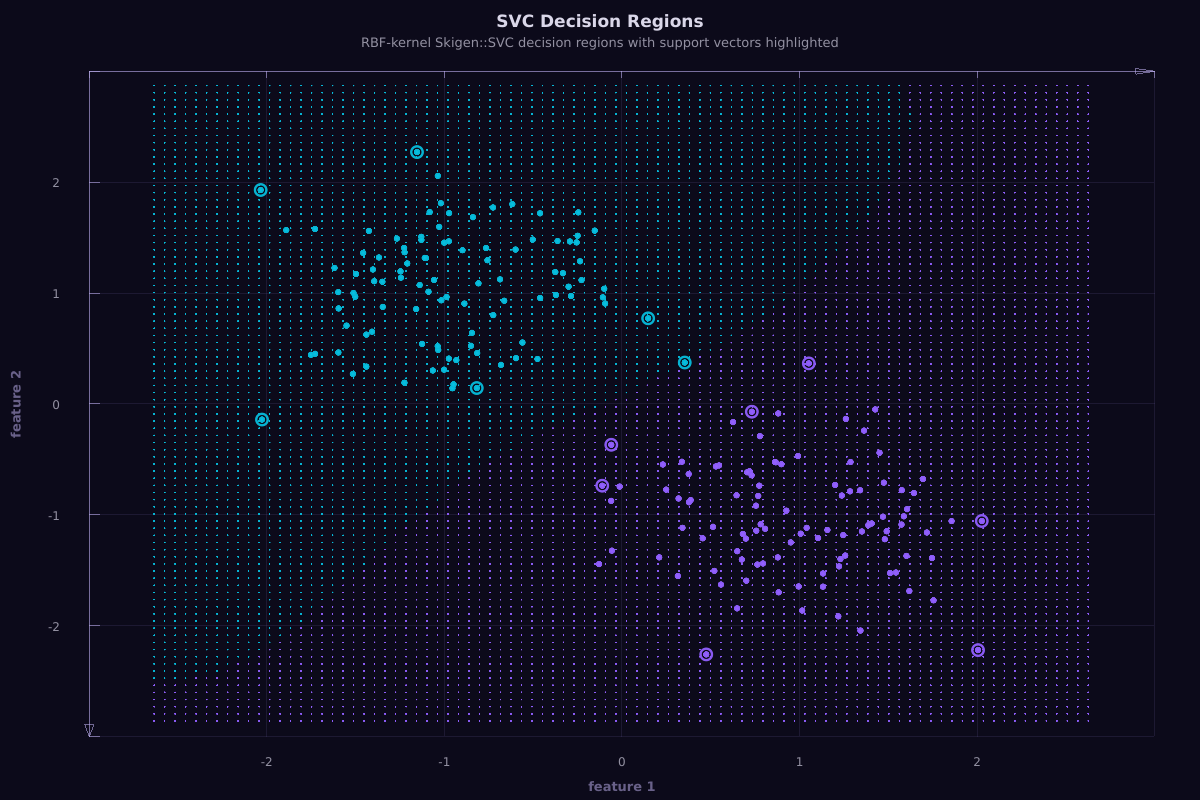
The figure below is rendered from a registered SkigenPlot-enabled example during the documentation build.
Source example: examples/svm/svc.cpp
constexpr int grid_side = 90;
Eigen::MatrixXd grid(grid_side * grid_side, 2);
const double x_min = X.col(0).minCoeff() - 0.6;
const double x_max = X.col(0).maxCoeff() + 0.6;
const double y_min = X.col(1).minCoeff() - 0.6;
const double y_max = X.col(1).maxCoeff() + 0.6;

int row = 0;
for (int iy = 0; iy < grid_side; ++iy) {
    const double gy = y_min + (y_max - y_min) * iy / (grid_side - 1);
    for (int ix = 0; ix < grid_side; ++ix) {
        const double gx = x_min + (x_max - x_min) * ix / (grid_side - 1);
        grid(row, 0) = gx;
        grid(row, 1) = gy;
        ++row;
    }
}

const Eigen::VectorXi grid_labels = clf.predict(grid);
Eigen::MatrixXd support_points(static_cast<Eigen::Index>(clf.support().size()), 2);
Eigen::VectorXi support_labels(static_cast<Eigen::Index>(clf.support().size()));
for (Eigen::Index i = 0; i < support_points.rows(); ++i) {
    const Eigen::Index sample = clf.support()[static_cast<std::size_t>(i)];
    support_points.row(i) = X.row(sample);
    support_labels(i) = y(sample);
}

Skigen::Plot::Figure fig;
fig.title("SVC Decision Regions")
   .caption("RBF-kernel Skigen::SVC decision regions with support vectors highlighted")
   .xlabel("feature 1")
   .ylabel("feature 2")
   .scatter(grid, grid_labels, {.pointSize = 2.0f, .opacity = 0.16f})
   .scatter(X, y, {.pointSize = 7.0f, .opacity = 0.92f})
   .scatter(support_points, support_labels, {.pointSize = 15.0f, .hollow = true});

return argc > 1 ? (fig.saveThemed(argv[1]) ? 0 : 1) : fig.show();