GradientBoostingRegressor
#include <Skigen/Ensemble>
template <typename Scalar = double>
class Skigen::GradientBoostingRegressor(loss=Loss::SquaredError, learning_rate=0.1, n_estimators=100, subsample=1.0, criterion=CriterionGB::FriedmanMSE, min_samples_split=2, min_samples_leaf=1, min_weight_fraction_leaf=0, max_depth=3, min_impurity_decrease=0, random_state=std::nullopt, alpha=0.9, verbose=0, max_leaf_nodes=std::nullopt, warm_start=false, validation_fraction=0.1, n_iter_no_change=std::nullopt, tol=1e-4, ccp_alpha=0)
Gradient Boosting for regression.
Stage-wise additive model that fits a sequence of regression trees on the pseudo-residuals of the current ensemble prediction. The final predictor is
where initialises the ensemble at the marginal mean (sklearn's init="zero" default uses a DummyRegressor that fits the mean — Skigen mirrors that behaviour exactly), is the learning rate, and each is a DecisionTreeRegressor trained on the residuals of stage .
Mirrors sklearn.ensemble.GradientBoostingRegressor.
Attributes:
-
loss : Loss
-
learning_rate : Scalar
-
n_estimators : int
-
max_depth : int
-
subsample : Scalar
-
init : Scalar
-
n_estimators_fitted : int
-
estimators : const std::vector< DecisionTreeRegressor< Scalar > > &
-
feature_importances : RowVectorType
-
train_score : VectorType
Methods
SKIGEN_PARAMS()
predict(X)
score(X, y)
Example
Plotting
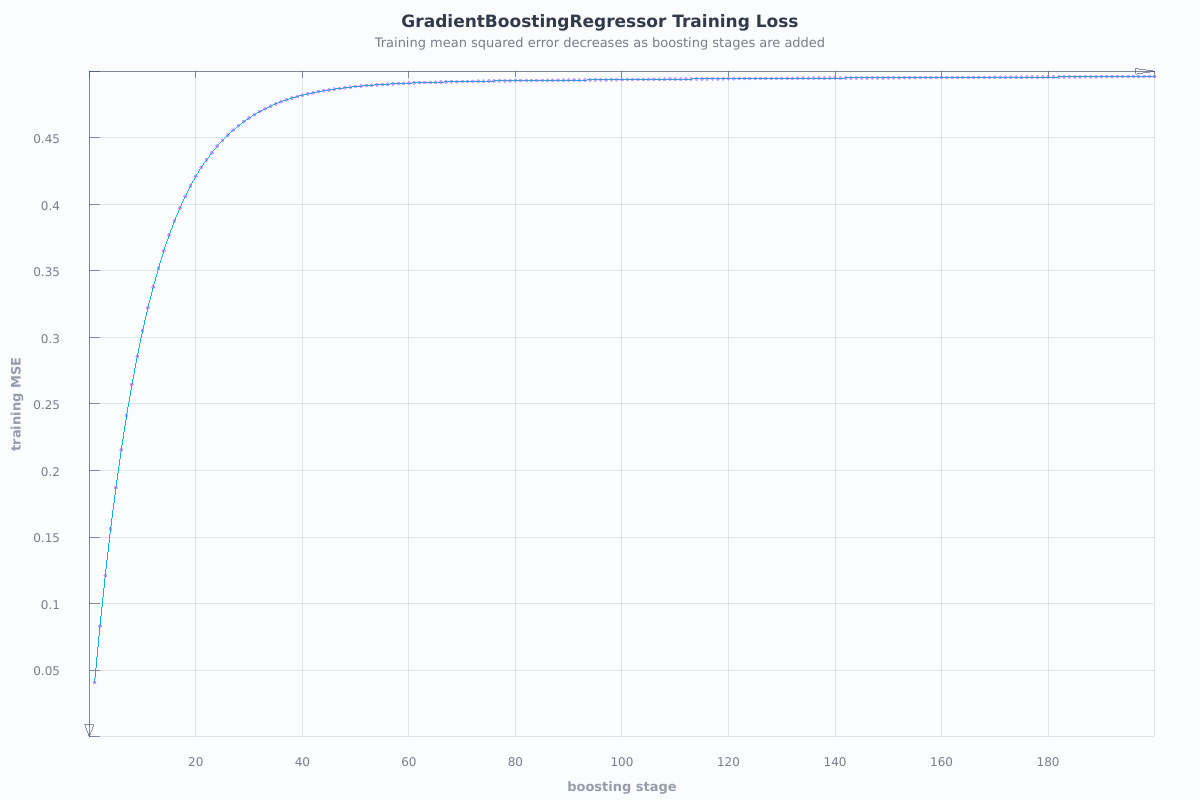
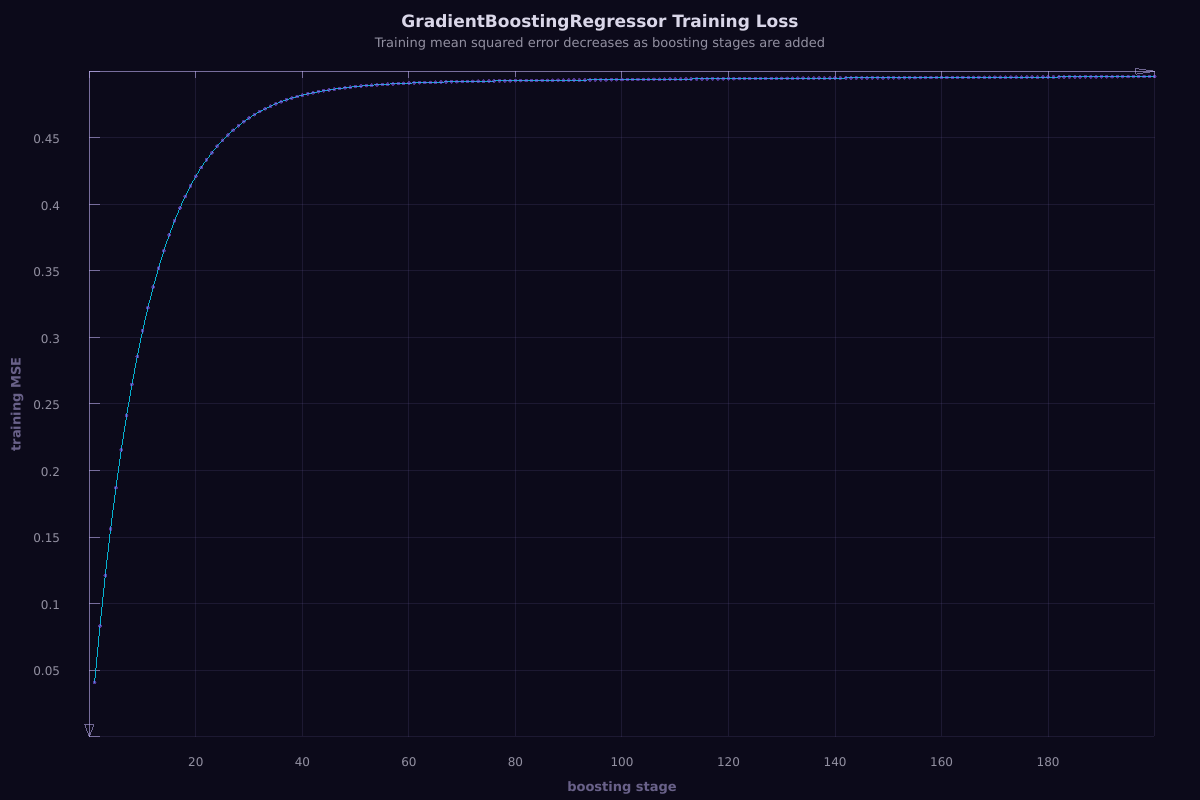
The figure below is rendered from a registered SkigenPlot-enabled example during the documentation build.
Source example: examples/ensemble/gradient_boosting_regressor.cpp
const Eigen::VectorXd stages = Eigen::VectorXd::LinSpaced(
    gb.train_score().size(), 1.0, static_cast<double>(gb.train_score().size()));

Skigen::Plot::Figure fig;
fig.title("GradientBoostingRegressor Training Loss")
   .caption("Training mean squared error decreases as boosting stages are added")
   .xlabel("boosting stage")
   .ylabel("training MSE")
   .plot(stages, gb.train_score(), {.lineWidth = 2.4f})
   .scatter(stages, gb.train_score(), {.pointSize = 4.0f, .opacity = 0.55f});

return argc > 1 ? (fig.saveThemed(argv[1]) ? 0 : 1) : fig.show();