CalibratedClassifierCV
#include <Skigen/Calibration>
template <typename Base, typename Scalar = double>
class Skigen::CalibratedClassifierCV(estimator, method=`CalibrationMethod::Sigmoid`, cv=5, n_jobs=1, ensemble=true, random_state=std::nullopt)
Probability calibration for a base classifier via cross-validation.
Mirrors the dense classification core of sklearn.calibration.CalibratedClassifierCV for an estimator that exposes decision_function(X) or predict_proba(X).
Splits the training set into cv folds. For each fold the base classifier is cloned, fit on the train portion, and applied to the validation portion to produce raw positive-class probabilities; a calibrator (sigmoid or isotonic) is then fit on (p_raw, y) for that fold. At prediction time, all cv (base, calibrator) pairs are applied and their calibrated probabilities are averaged (ensemble=true, the sklearn 1.7 default). With ensemble=false, the out-of-fold predictions fit one calibrator and the base estimator is refit on the full training data.
Attributes:
-
method : CalibrationMethod
-
cv : int
-
ensemble : bool
-
classes : const Eigen::VectorXi
-
n_classes : int
-
n_estimators_fitted : int
-
folds : const std::vector< FoldFit > &
Methods
SKIGEN_PARAMS()
predict(X)
predict_proba(X)
Return averaged calibrated class probabilities, shape (n_samples, n_classes).
Example
Plotting
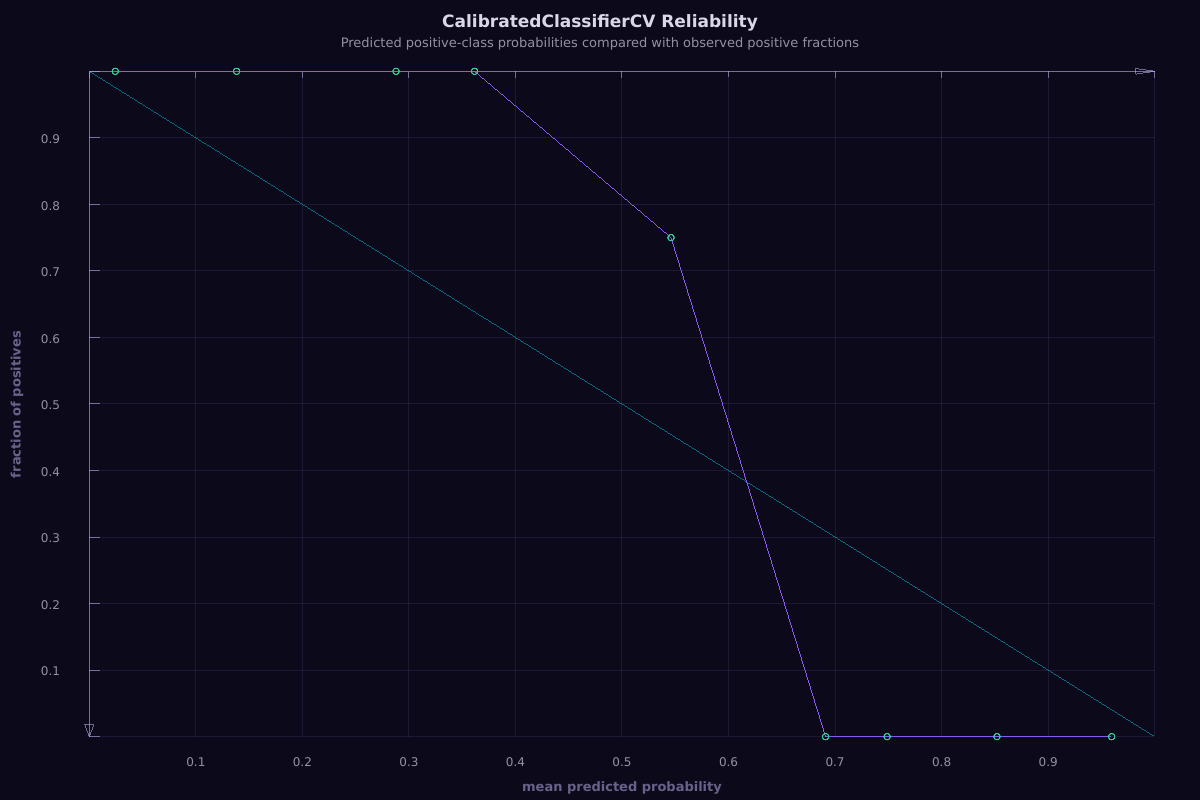
The figure below is rendered from a registered SkigenPlot-enabled example during the documentation build.
Source example: examples/calibration/calibrated_classifier_cv.cpp
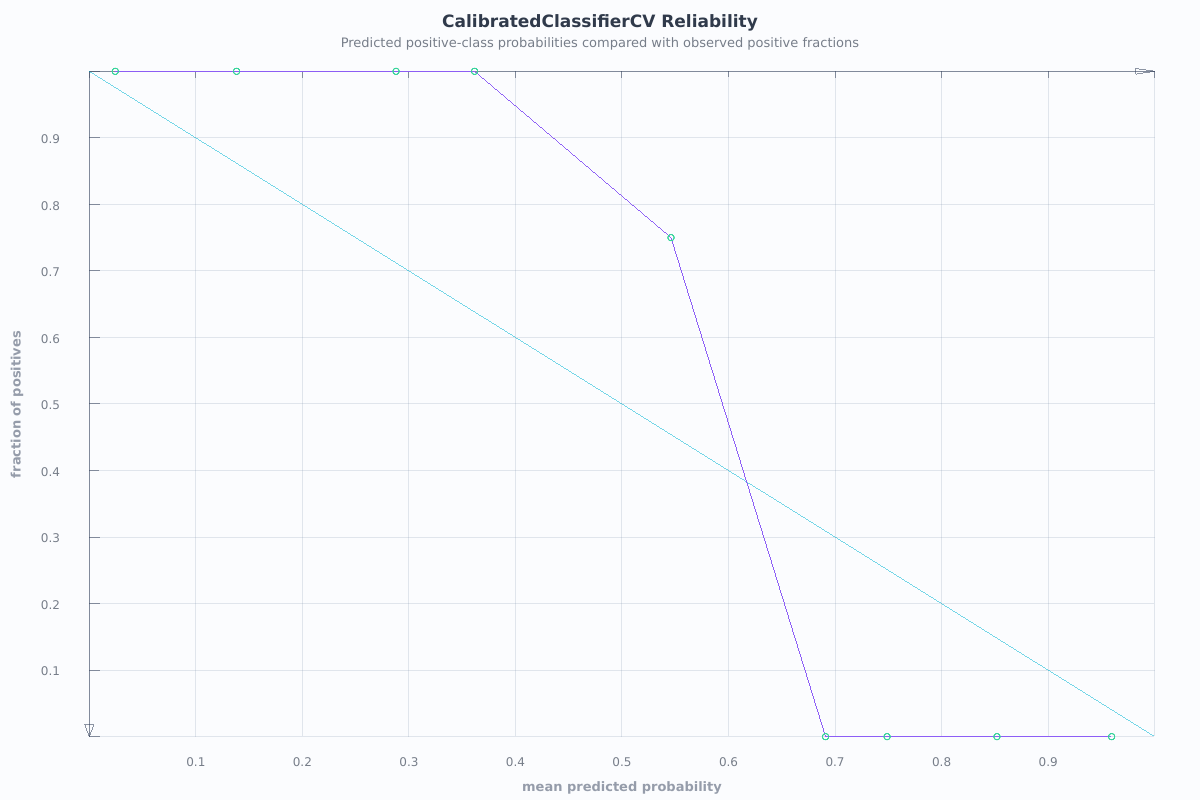
const auto [mean_predicted, positive_fraction] =
    calibrationCurve(y, probabilities.col(1), cc.classes()(1), 10);
Eigen::Vector2d diagonal;
diagonal << 0.0, 1.0;

Skigen::Plot::Figure fig;
fig.title("CalibratedClassifierCV Reliability")
   .caption("Predicted positive-class probabilities compared with observed positive fractions")
   .xlabel("mean predicted probability")
   .ylabel("fraction of positives")
   .plot(diagonal, diagonal, {.lineWidth = 1.2f, .opacity = 0.55f})
   .plot(mean_predicted, positive_fraction, {.lineWidth = 2.6f})
   .scatter(mean_predicted, positive_fraction, {.pointSize = 8.0f, .hollow = true});

return argc > 1 ? (fig.saveThemed(argv[1]) ? 0 : 1) : fig.show();